Markets
Understanding Equity Market as Multiple Pendulums Instead of Just One
Equity market commentators regularly pronounce that the market is expensive, and at other times that it is cheap. At a very broad level such a call may even be right, but it is not really helpful to know. Take a recurring pattern in market commentary: a bubble gets called in some pocket of the market, say small and mid caps, and the call gets repeated for months on end. Leaving aside whether any particular call was right or wrong, the question is what one does with this information. The obvious impression from such statements is that one should sit out or take a cash position, and acting on that impression is often the wrong move.
Right or wrong, the statement is too broad to be acted upon, and hence should not be acted upon. It needs a further drill-down, unless one is a very broad index investor. Whether the call is expensive or cheap, as soon as one digs deeper one will see that not everything is equally expensive, and not everything is equally cheap. No one needs to buy the entire market. People invest in direct equities, indexes based on market capitalisation, thematic indexes, custom indexes (e.g. small cap), mutual funds, and so on.
Then, is there another way to make sense of the market than thinking at the level of all the stocks, or does each stock have its own independent pathway with no room for abstraction?
There are three abstract models worth examining here.
Market cap based
It breaks down the overall market of stocks by market cap (i.e. small, mid, and large). This is not very helpful, as it doesn’t establish the connection between market cap and the fortune of the companies in them. A technology business and a chemical business, even in the same market cap group, don’t tell us why they should share the same fundamentals and hence be expensive or cheap. Such a grouping may fit some stocks but not others, which makes it a lazy model to work with.
Liquidity
These are used by investors who rely on macro-economic understanding to gauge the profile of the market. The idea is that the direction and quantum of liquidity determines how markets and market segments will behave. Liquidity-based investing is far more complex than it appears, because it depends on a large number of variables, among them interest rates, currency flows, government borrowing and global risk appetite, all interacting with each other in unpredictable ways.
Themes, industry, and sectors
Here we break down the businesses by their industry, sectors, and themes, and then try to understand what is happening in them. The idea is that businesses in the same industry have similar business drivers (demand, supply, and regulation), and hence their stock prices are likely to be more closely related. At any point in time some industries are strengthening while others are weakening, and reading that correlation tells you more than treating the market as one number.
Why this approach works
This approach is the most sensible because it is based on the idea that there is a bull market somewhere due to strong business tailwinds in those industry segments. Similarly, there is a bear market in some. This allows one to take action and stay invested, instead of taking a cash call or a do-nothing call. If one can learn how to gauge the fundamentals of different industry segments, then one can orient their portfolio accordingly. As one industry segment goes from strong to weak, one can exit and move allocation to another segment that is looking up. Industry cycles usually last for a few years, so this switching of industries can happen slowly as trends become more and more obvious. The number of industries with positive momentum may not always be the same, but it is unlikely they will become zero.
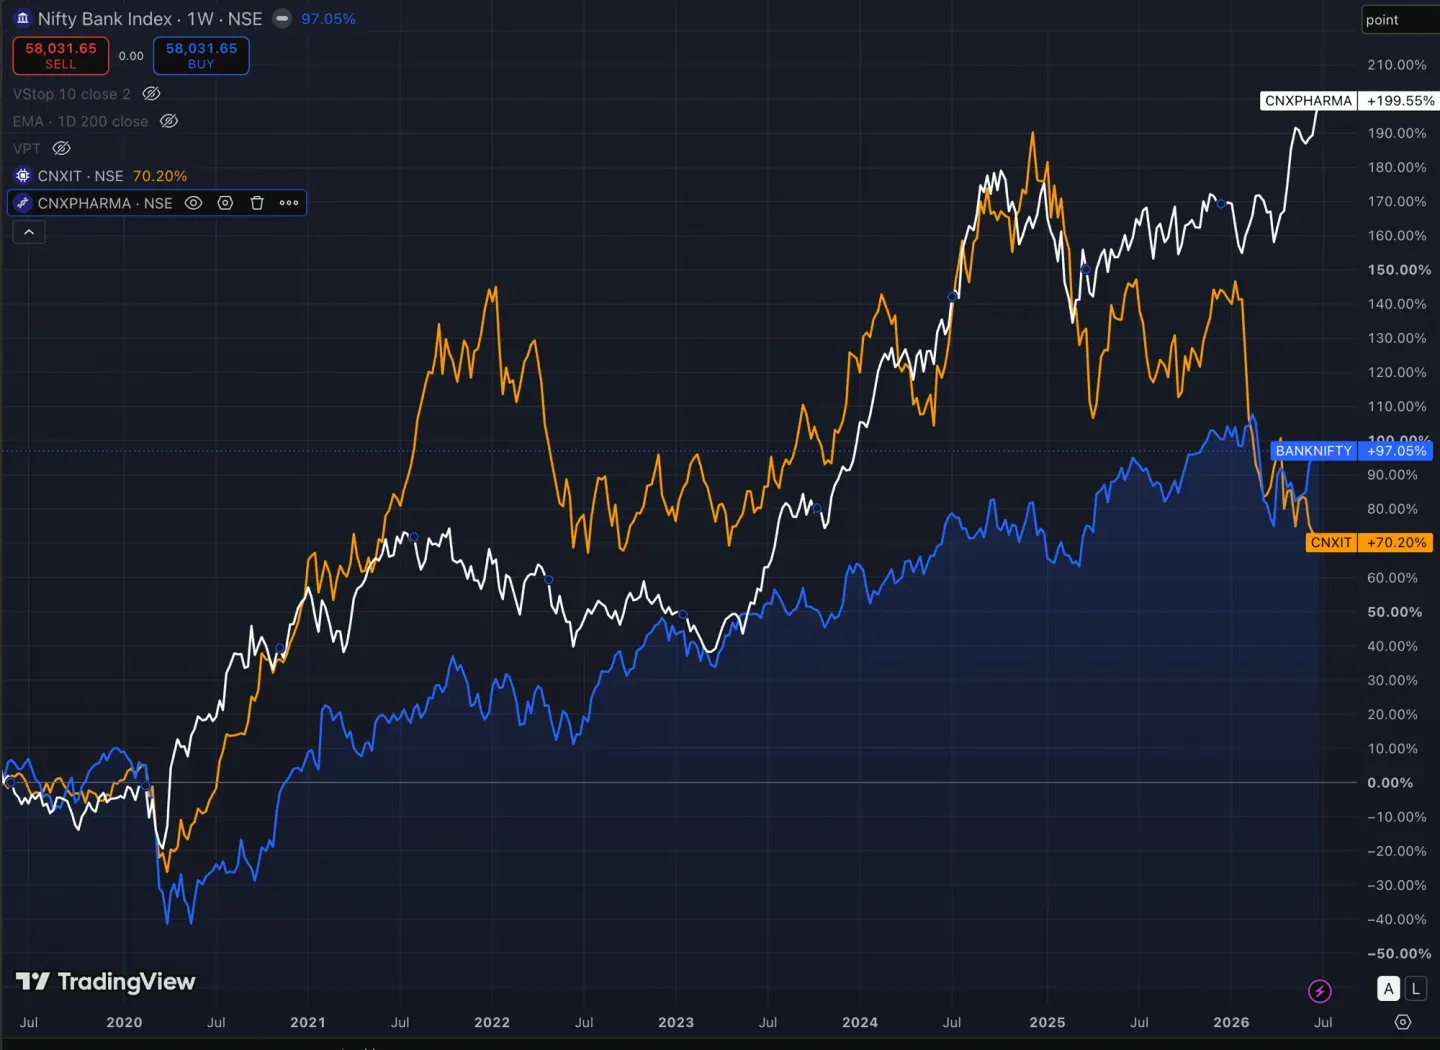
Pharma and IT rallied together after the Covid crash, went sideways through 2022-23 while banks caught up, then peaked together in early 2025. Between early and mid-2026 the two split apart: IT gave back gains from ~140% to 70%, banks eased off too, and pharma alone broke out to +199%.
The amount of money that one needs to keep idle also becomes much less, since the choice is no longer a binary, in-out one.
One can also calibrate how one focuses their time. Industries going through a downturn require much less time, as one needs to check whether the cycle is turning or not. On the other hand, one can spend a lot more time understanding businesses in emerging sectors.

Each industry is its own pendulum, at a different point in its swing.
A very high-level picture of the market then becomes that of dozens of pendulums swinging from cheap to expensive, or from fear to greed, which is a good deal more useful than watching just one.
Try Margin
Put this into practice
Margin gives you DCF valuation, Reverse DCF, XIRR and capital gains tracking in one place. Free, no credit card required.
Start for free